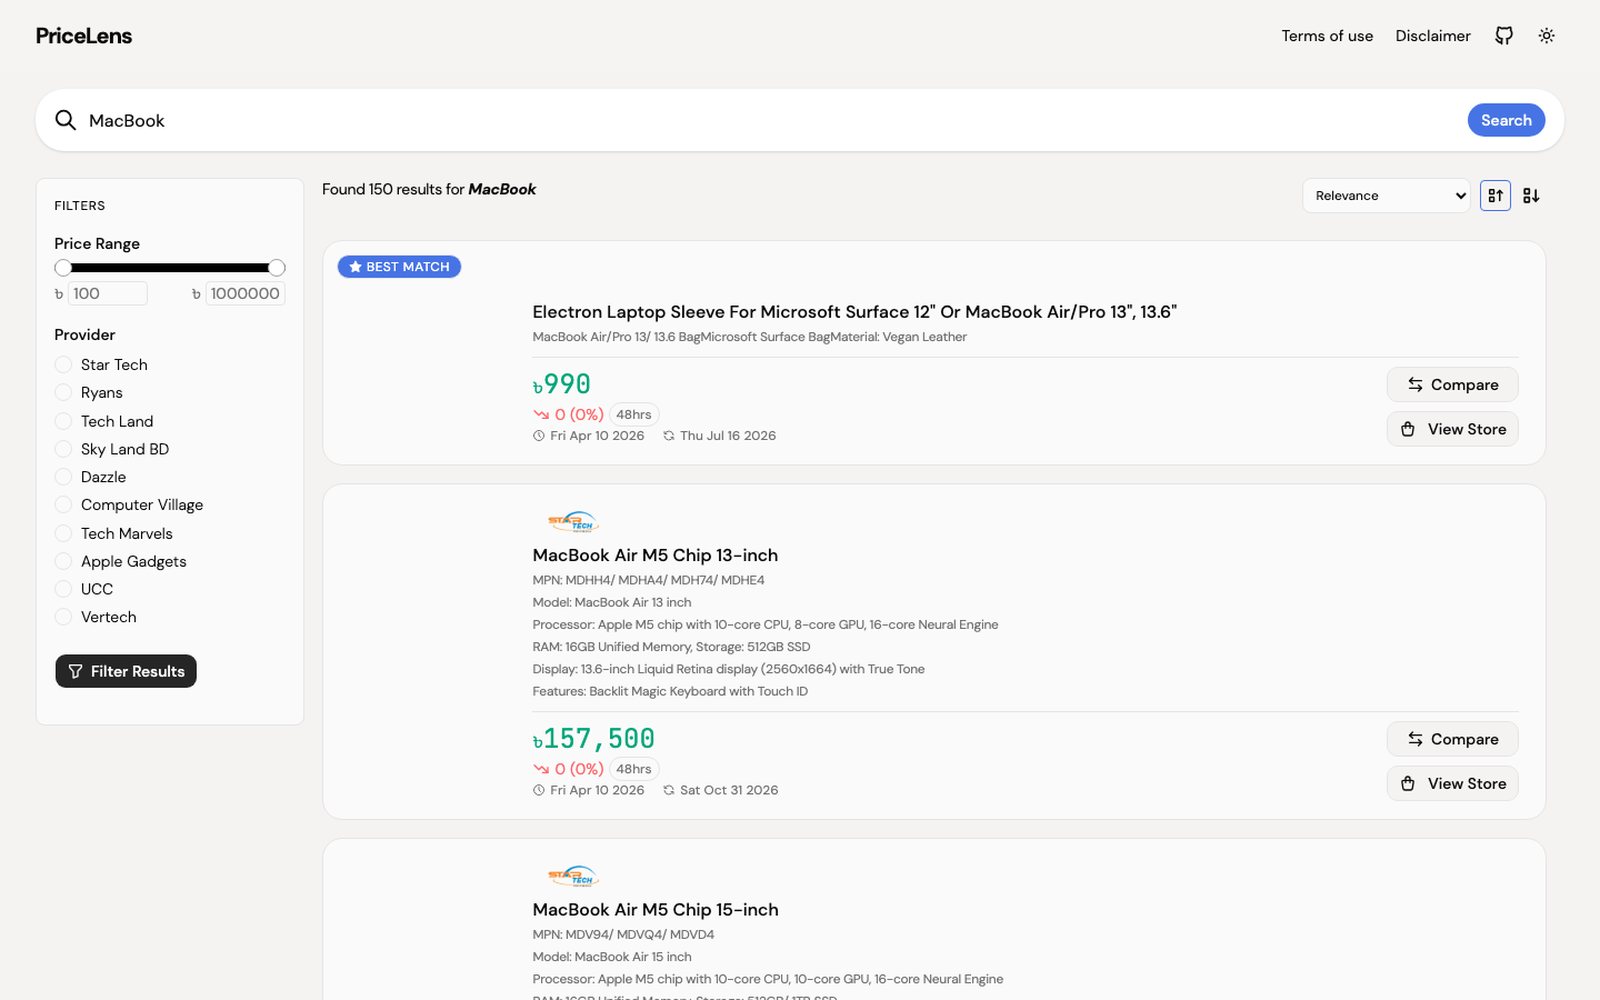
PriceLens started with a boring question: why is the same laptop a different price on every Bangladeshi retailer’s site, and how often does that change?
I built a tracker to answer it. The tracker became a dataset: 1,274,246 price observations for 26,658 products from four retailers, recorded between 25 March and 28 September 2026 and published on Mendeley Data with Sreya Mazumder. This is how it works and what is actually in it.
The scraper
Each retailer exposes product pages in a different shape. Some use predictable URLs, some load prices with JavaScript, and some change their markup without warning. The scraper therefore does not assume a single page template. It stores a queue of product URLs and rebuilds that queue every 12 hours, so new products enter the panel and dead listings leave it.
That rebuild interval is a trade-off. A shorter interval would capture more price changes, but it also increases requests to sites that did not ask to be monitored. Twelve hours keeps the load reasonable while still producing a usable panel. The median time between two observations of the same product ended up at 53 hours, because the queue is large and not every product is visited on every pass.
What one observation contains
Every row has the price in Bangladeshi taka and poisha, a UTC timestamp, and the product and retailer it belongs to. I deliberately store the timestamp in UTC rather than local time. Daylight and timezone assumptions are easy to get wrong once data leaves the machine that collected it.
The product table keeps each product’s name, URL and retailer. A separate text-history table records name changes and SHA-256 hashes of product descriptions. The descriptions themselves are not included: they are the retailers’ copyrighted text, and the hash is enough to detect a change without republishing it.
The quality flags
Raw scraped prices are messy. A page can show a discounted price, a financing price, an out-of-stock placeholder or the previous price because JavaScript did not finish loading. Deleting suspicious rows would hide those problems, so I kept every row and flagged it instead.
The flags cover price changes, carried-forward prices, outliers and implausible values. Of the 1,274,246 observations, 1,205,045 are clean. The rest are still in the dataset with a reason attached. Anyone analysing the panel can decide whether to drop them, weight them or study them.
Carried-forward prices deserve a note. When a retailer stops updating a listing but the page still resolves, the scraper may see the same price for weeks. Computer Village is the clearest example: observed prices end on 3 April 2026, and later rows are flagged as carried forward. Treating those rows as fresh observations would invent price stability that does not exist.
Publishing the panel
Seven retailers were scraped. Three were excluded, along with some Computer Village products, to comply with the retailers’ terms of use and robots.txt. That decision reduced coverage, but a dataset built by ignoring site rules is not one I want to defend.
The published version includes a README with the data dictionary, a datasheet describing collection and suitable uses, and a SHA-256 manifest so the files can be verified. The known limitations — survivorship bias, coverage gaps and their causes — are written down rather than left for someone else to discover.
The record is on Mendeley Data under CC BY 4.0:
Biswas, J., & Mazumder, S. (2026). PriceLens: A Panel of Online Electronics Prices from Bangladeshi Retailers, 2026. Mendeley Data, V1. https://doi.org/10.17632/jvkn4hsjgp.1
What I would do differently
Two things. First, I would model retailer-specific price semantics earlier. A “price” on a product page can mean cash price, card price, instalment price or a struck-through reference. One column cannot carry all of that cleanly.
Second, I would schedule the queue by change frequency instead of treating every product equally. Fast-moving products deserve more observations; a product that has not changed in a month does not need the same attention. That would improve the panel without increasing load.
The dataset is open if you want to test either idea. The code behind the tracker is not public, but the data dictionary and datasheet are detailed enough to work from.